SANDAG Transportation Resources

SANDAG Senior Research Analyst Mike Calandra sent us some traffic data updates for our Data As a Public Good report. I’m always thrilled when I get to communicate directly with agency analysts, and having them write to me is like an early Christmas. In our Data as a Public Good report several interviewees reported that they had difficulty getting traffic data from SANDAG, and the SANDAG website only publishes traffic count data as a PDF or an interactive map. However, SANDAG was very responsive to my Public Records Act Request for the traffic counts in a structured format, and we’ve got the response from that request in our repository, so we’ve updated the report to reflect this more recent experience, and here are some other resources that Mike mentioned. SANDAG is current in the process of updating their traffic count reports and replacing them with a Regional Count Database. The application will be an interactive map with a focus on arterial streets. CalTRANS, through their PEMS application, reports counts for freeways. PEMS also has about 10 years of data for many other traffic metrics, such as collisions. Every 10 years, SANDAG does a survey of county residents about travel. The last one was conducted in 2006. I haven’t read the report in enough detail to assess the quality of the statistics, but I’m already really impressed with the design and methodology – see “Cognitive Interview” appendix on page 132 for a lesson on how to do a survey right. If the survey company, NUSTATS, put as much work into statistics that they did in designing the survey, this report has the best data it would be possible to get. Mike sent a few other links that I knew existed, but hadn’t seen, such as these links to forecasts:

Continue Reading →

Population Density Maps

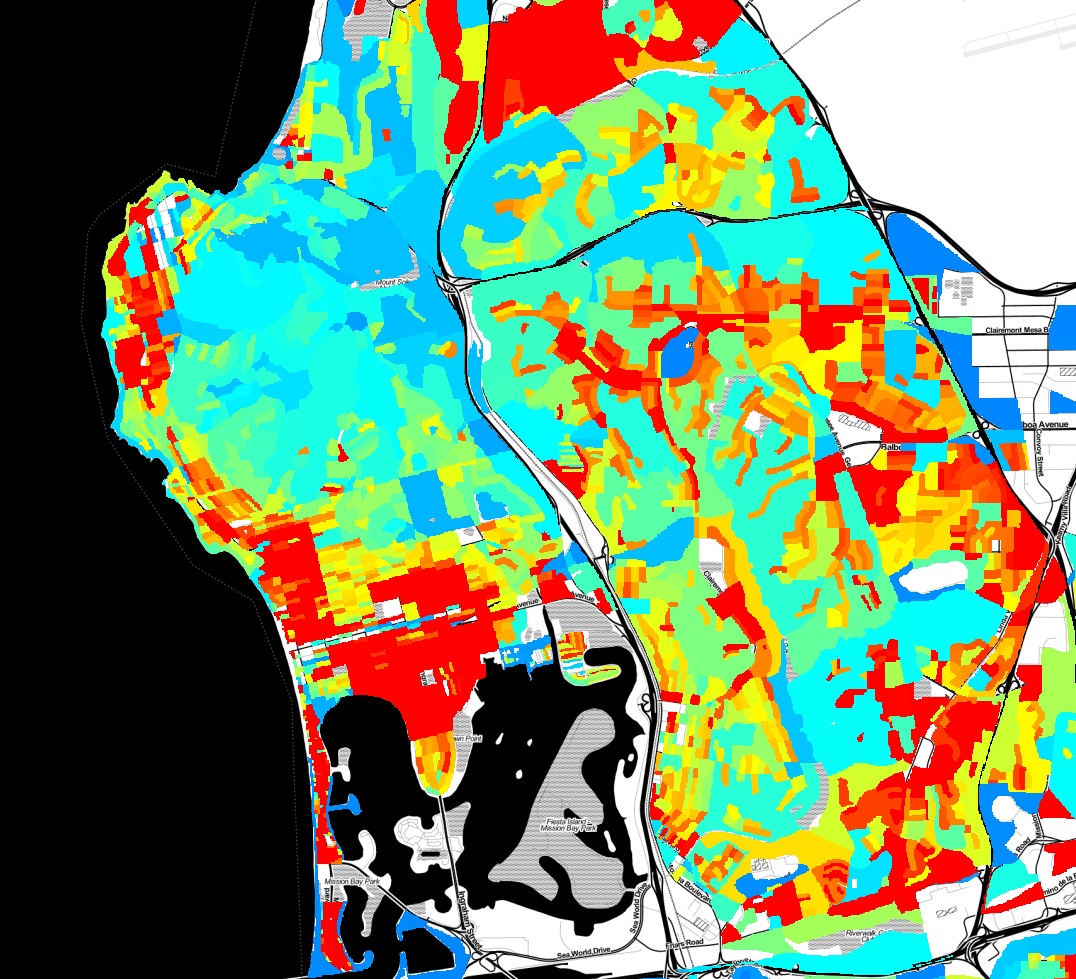
Here is some eye candy, a population density map of Pacific Beach and surrounding neighborhoods.

population-density-map

This map was created with a lot of Python code, using the 2010 census shapefiles for census blocks, setting a value for each block as the population of the block divided by the area of the block, and rasterizing all of the blocks to an image. Red indicates areas of higher population density. You can clearly pick out the areas in Pacific Beach that are zoned for apartments vs single family homes, the UTC high-rise apartment area, and many other variations in land use.

Continue Reading →

Report: Municipal Open Data Policies

We’ve released a new report, Municipal Open Data Policies. The best way to ensure that San Diego area nonprofits and citizens get useful data is for local governments to adopt Open Data policies. These policies, which have been implemented in many cities around the country, mandate that cities publish data. So, instead of fighting for months to get data through a Public Records Act request, you can just download what you want from a website. Our latest report, Municipal Open Data Policies, analyzes 10 documents from other cities and breaks down their components, to create a guide for our own leaders to use when crafting similar policies for San Diego. Open Data policies are increasingly popular because they are powerful commitments to openness and have a broad range of benefits to citizens, social organizations and civic groups. With more open data, everyone in the region can work together to improve our communities. That’s a future that the San Diego Regional Data Library is working toward, and one that our governments can support by adopting Open Data Policies.

Continue Reading →

Report: Data as a Public Good

Our first report, Data as a Public Good, assesses data requirements from over 20 civic and social organizations in the San Diego region and documents specific needs for municipal data. The report highlights the datasets that city governments control that would be most useful to the public if they were easily available. The report also discusses limits to access and makes recommendations about how San Diego regional governments can release data without imposing a high cost burden on departments. Government is a cornerstone of any successful community data program. Governments produce and control some of the most valuable data, and they can either be powerful advocates for public use of data, or the most significant obstacles. Please see the report, Data as a Public Good for our analysis and recommendations for how local governments can drive community development through open data.

Continue Reading →

TGIF Chula Vista, It's Crime Minimum Day

Our resident data slinger sent me an initial analysis of time series data for specific crime hot spots in San Diego, and the results are interesting. Rather than look at the whole of the region at once, we’ve identified specific high intensity areas, and are doing time-series analysis for them independently. The major areas are: North Park, Chula Vista, Gaslamp and Pacific Beach. Since each of these areas is very different, they have different crime profiles, so we’re analyzing them separately. Here is the map for the Chula Vista analysis area:

Continue Reading →

New Data: XKCD Didn't Win

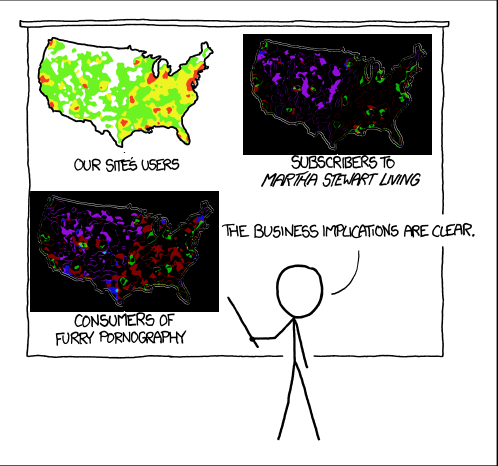
An earlier post commented on an XKCD cartoon that was related to a common misinterpretation of crime maps, and I’d noted that it would be interesting to find the difference between the maps, as we had done for violent and property crime. Some of us think about interesting things, and others do them, Paul Breed sent in this difference analysis.   difference Purple is more “our site’s users”, and Green is more Martha and pornography. If the stick figure had done a little more analysis, he’d have discovered that there is no business implication.

Continue Reading →

What Is Crime Analysis?

On Wednesday March 6 we’ll kick off our Crime Data Analysis project, and before then, it may be worth asking “Why are a bunch of amateurs attempting what the police should be doing? " The answer is that police departments analyze crime to catch criminals, and the Data Library analyzes crime to help residents understand their own communities. We data geeks aren’t very good at catching criminals, so we’re happy to leave that task to the pros. Our project will cover only two small aspects of the field of Crime Analysis. We’ll be doing strategic analysis, looking at long term trends, and descriptive administrative analysis, which is creating summary reports for community leaders. So, some of the activities that we’ll tackle as part of this project are:

Continue Reading →

Fight Crime with Data

Citizens of any skill level are invited to help us analyze crime in San Diego neighborhoods. Use your knowledge of the community or technical skill to create maps, discover anomalies, and better understand the causes and solutions to crime in San Diego. Come to the Kickoff meeting by signing up at Meetup.com Crime is always a top issue for any community, but San Diego residents, town councils and community planning groups seldom see neighborhood analysis of where crime occur, and less frequently get analysis of how crime relates to factors such as street lighting, traffic, housing, or alcohol. In this project we will collect data from the city, state and private organizations to create a range of maps and statistics that explain where crime is occurring and what factors are involved in increases or decreases in crime. This project needs your help,regardless of your skills or skill level. You can participate as a non technical community activist, Excel jockey, GIS expert, beginning programmer or experienced statistician. Want to know more?

Continue Reading →