San Diego Open Data Day

This weekend, Saturday Feb 23, is International Open Data Day, sponsored by the Open Knowledge Foundation, and it is also Code Across America data, sponsored by Code for America. San Diego is participating, hosted by Open San Diego, and the Library staff will be there to talk about the Library and our Crime Mapping Project. If you’d like to participate in the conference sessions or hackathon, visit the EventBrite page to sign up. Hope to see you there.

Continue Reading →

XKCD Always Wins

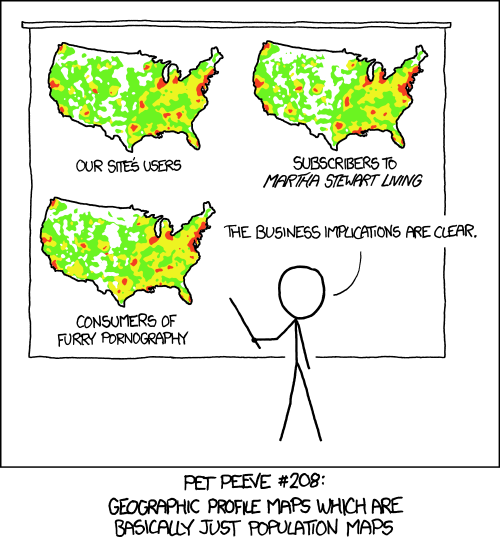
I shouldn’t be surprised that for any interesting technical idea, XKCD covered it first, and better. Here is another view of the issue we covered regarding crime mapping: crime is most common where (a) there are a lot of people and (b) there is alcohol, and (b) is often the reason for (a).     To go ahead and ruin the joke with over analysis, the maps in the cartoon aren’t exactly the same. So, it might be interesting to subtract them from each other and explore the differences.

Continue Reading →

Property vs Violent Crime

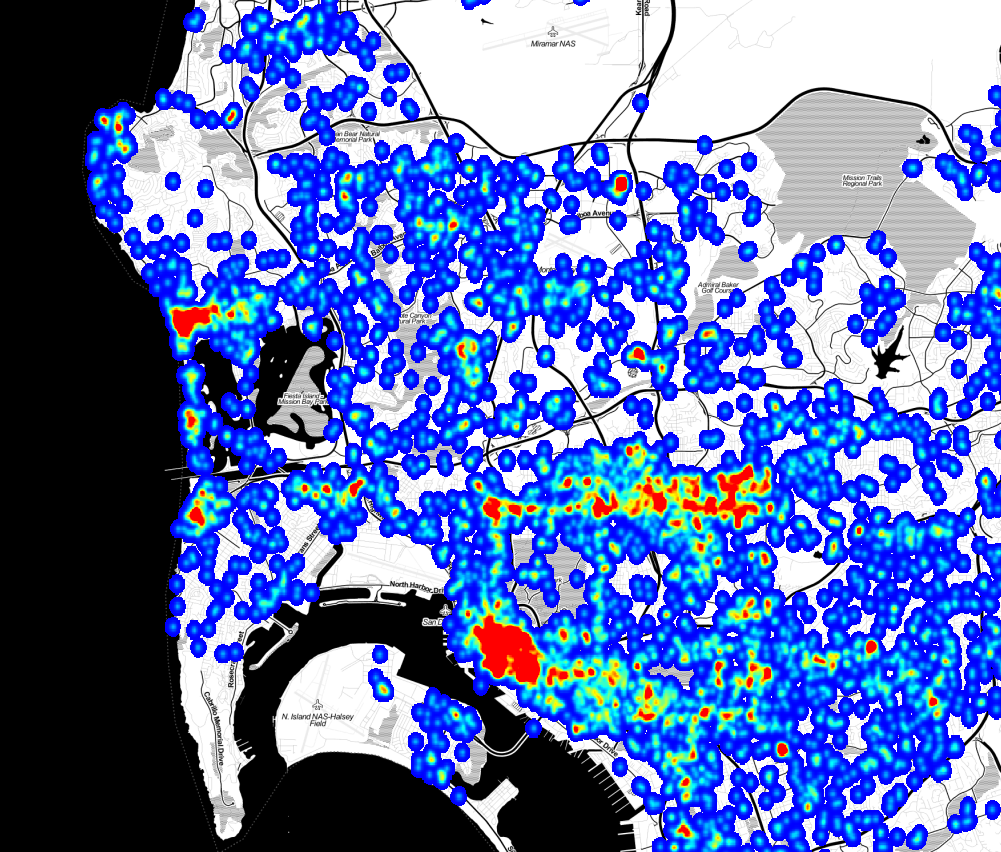
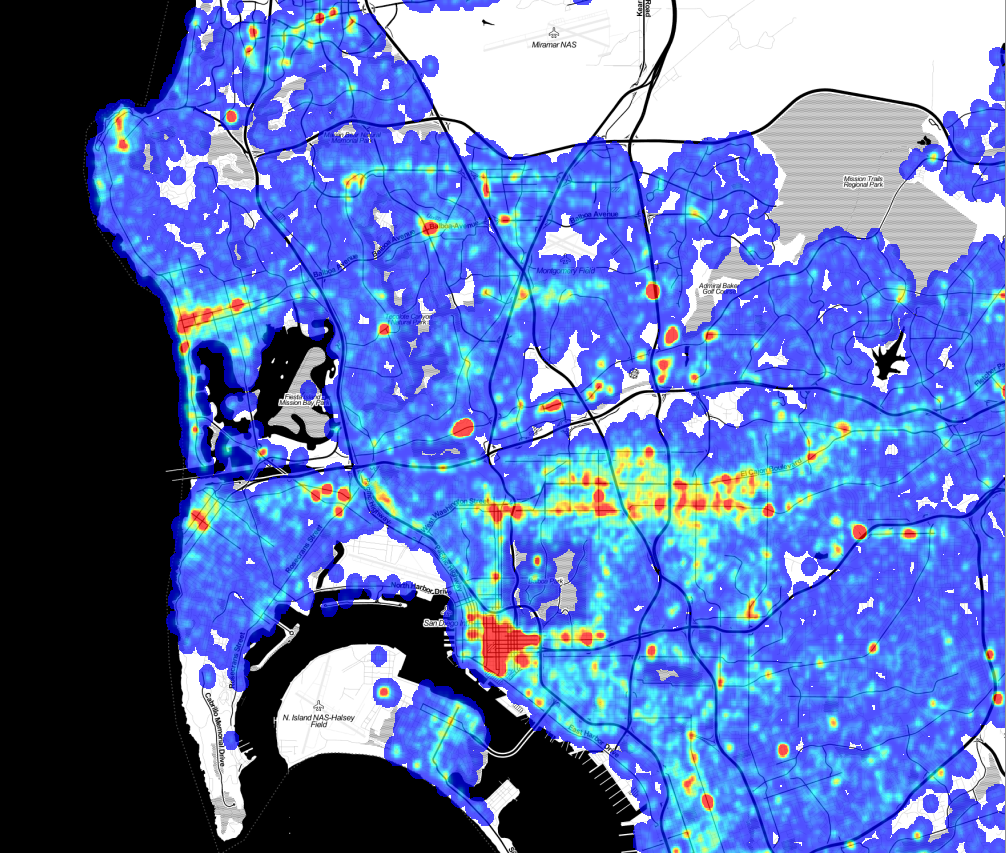
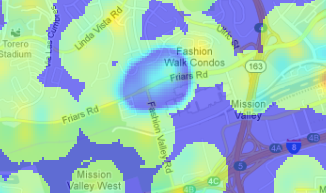
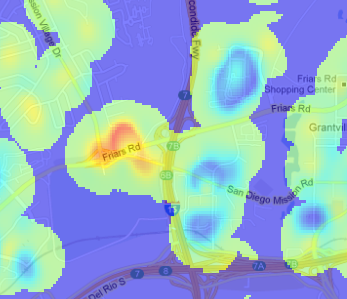
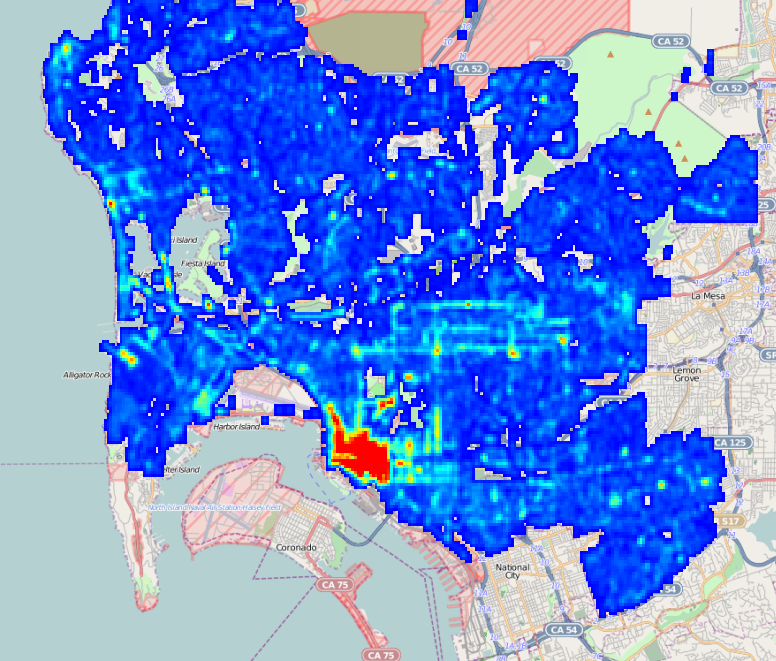
As part of our upcoming Crime Mapping project, we’ve started producing maps of San Diego area cime incidents, and have made a few interesting discoveries that we’d like to share. While these aren’t ground-breaking insights, the results do confirm intuition and offer some small surprises. A few months ago we received and processed the SpotCrime.com free database, a database of crime incidents from across the country for the years 2007 to 2011. This data was scraped from many different police department websites, although the San Diego data was all scraped from ARJIS ( part of SanDAG ) before SANDAG changed the map software, eliminating the possibility of free acess. This database is a wonderful resource, and even though the data does not have an official pedigree, there are enough datapoints to do some useful work. SpotCrime is providing an incredible benefit by offering this data. Thanks! Our first stage of analysis involves creating heatmaps from the incidents. To create these maps, we quantized the incidents into bins 1/5000 of a degree square, about 19m. Since the records are typically reported with a “hundred block address” – “1300 Wilbur Ave” instead of “1324 Wilbur Ave” – we added a bit of randomness to the points. While this isn’t exactly correct, as it randomly moves the incident by up to 100m, it does space the points out in a more natural way. Then, for each incident, we spread out the crime point ( with a 2-D Gaussian, fwhm = 57m) to smooth out the image. The spreading also simulates both the extended “influence” of a crime, and the fact that a crime at one point means it is more probable that a crime will occur at nearby points. Violent crimes are separated from from the property crimes with a separate map for each. Here is the violent crime map: ( Click to Enlarge) Violent Crime Incidents, 2007 - 2011. Data from SpotCrime.com Violent Crime Incidents, 2007 - 2011. Data from SpotCrime.com The red spots are the areas of the highest number of crimes, and almost all of them are entertainment districts. Violent crime tends to occur at night, where there are a lot of people, and where people are drinking, and an entertainment district has all three conditions. Here is the map of the property crime incidents. This has more complete coverage because there are a lot more property crime incidents than violent crime incidents. Property Crime Incidents, 2007 to 2011. Data from SportCrime.com Property Crime Incidents, 2007 to 2011. Data from SportCrime.com There are a lot of similarities in where the crimes occur, but the property crimes are more diffuse, and there are many small-scale differences. To find the differences between the two, we can subtract the two maps. In this image, blue indicates areas where property crimes dominate, green is neutral, and red is an area where violent crimes dominate: Property / Violent crime DIfference Violent crime density minus property crime density. Note that in this map, green does not mean “good,” it means that the difference in the density of violent crime and property crime is nearly equal. The green areas can have very high violent crime rates; being green just means they also have high property crime rates. This map gets really interesting when you zoom in to look at specific spots. Closer examination doesn’t reveal a lot of new discoveries, but it does confirm intuition about where we should find property and violent crimes. Fashion Valley MallThis high-property crime area is Fashion Valley Mall. It seems sensible that the mall would be a target for theft, but the upscale shoppers don’t often get into altercations. Mission Valley mall has a similar emphasis on property crimes.
Qualcomm StadiumQualcomm stadium, in red, is a hot spot for rowdy sports crowds, but the apartments along the golf course, while actually having a higher than average violent crime rate, see relatively more property crime.
(There is an interesting error in the difference map. The values for each map are scaled so that the range of ±4σ in the original output maps to (0,1] in the final output, so high outliers all have the value of exactly 1. This means that for an area with both high property and violent crime, the difference is exactly 0, which is the no data value. This is why Garnet street in Pacific Beach and the Gaslamp district have areas of no data in the difference map. ) A map like this has a lot of interesting stories to tell, even though the analysis is not very rigorous. We started with data that we can’t vouch for, added randomness, created a map with a lot of arbitrary choices, and ended up with useful insights. The entire process emphasizes that even when data and analysis are not of sufficient quality to make statistical inferences, we can still extract useful knowledge.
Continue Reading →

Crime And Street Lamps

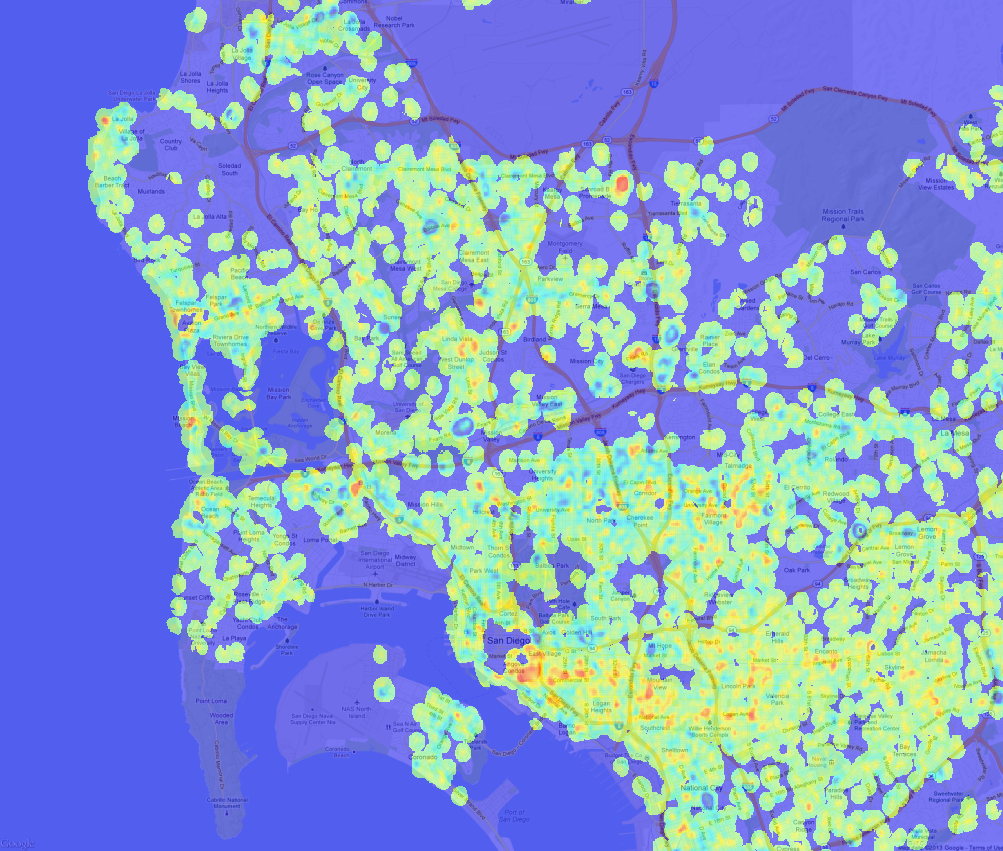
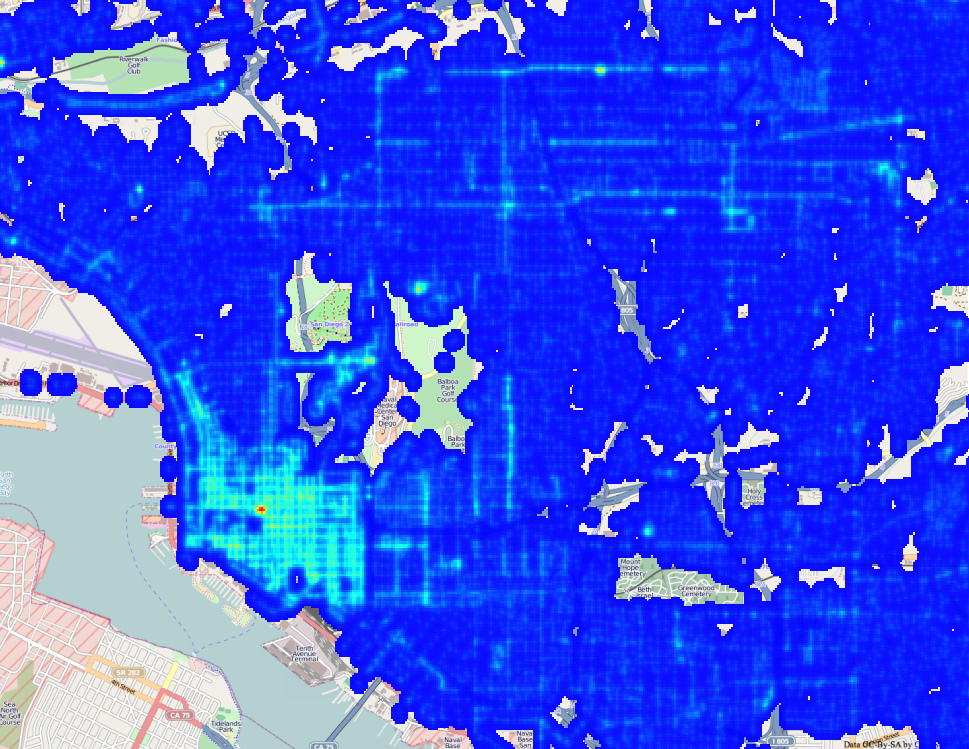
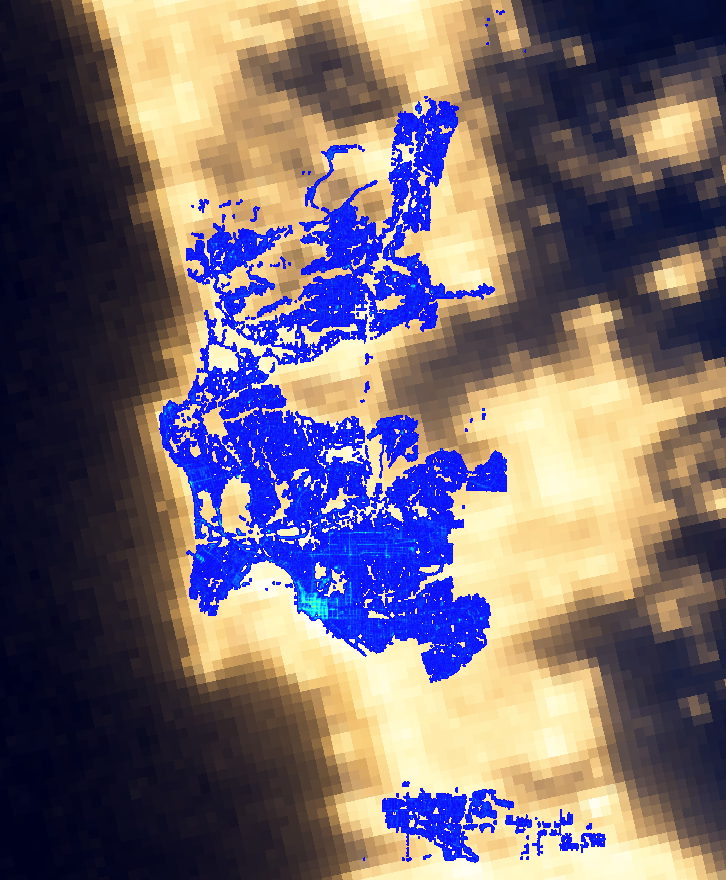
Street Light Density MapIn preparing to formally launch the San Diego Regional Data Library, we’ve been spending a lot of time talking to nonprofits, community planing groups, city staff and city council members about their data needs. The staff for District 9 mentioned that Council member Marti Emerald is interested in infrastructure issues, particularly how crime is related to infrastructure deficits. Her staff specifically mentioned street lamps. Fortunately, we have a fantastic resource in SanGIS, and they have published a shapefile with the locations of San Diego Street Lamps. So, we went to work extracting and processing street lamp data. Based on this data, we’re creating density maps of street lights, which we will correlate with crime incidents. The map shown here is one of the example maps we’ve produced, to experiment with how best to represent the data. For this map, I wrote a Data Bundle that converted the Shapefile of street lights provided by SanGIS into a Sqlite file, which was then loaded into an image. ( You can get the code for my bundle on GitHub. ) The processing code bins the location of the street lights to 1/4000 of a degree, about 18 meters at out latitude, then for each street lamp, adds a matrix onto the output image. The matrix spreads out the point, a bit like the light from the lamp would spread out. Here is a high resolution view of the output, showing Uptown, Downtown , the Park and Golden Hill. ( Click to expand ) Screen Shot 2013-02-10 at 1.57.29 PM This is, of course, a synthetic view of light in San Diego, but NASA has generated the real view, by photographing the earth at night. Here is our map laid over NASA’s image: Screen Shot 2013-02-10 at 2.01.19 PM Our data covers only San Diego, so there are many areas that are lit where we don’t have street lamp records, and it also appears that from space, light spreads much more than we estimate with our spreading matrix. Regardless, the maps show a good correspondence. This is a simplistic analysis, since it doesn’t consider the different types of lamps, their power, or the occlusion of buildings, but it does illustrate how to make and present a density map. This is the first step in our crime analysis project; the next steps will study how the locations of street lamps relate to the locations of crime. For the full project, we will have to consider that the correlation between crime and street lights isn’t only one way. There may be more crime in dark areas, but the city may also put more lights in high crime areas, breaking a simple correlation. So, we will probably focus on finding areas that are both dark and have high crime. If you like this sort of analysis, please join our Meetup group or connect though Facebook, Twitter or email to get the announcement for the start of our crime analysis project. We’d love to have your help!

Continue Reading →

San Diego Civic Engagement

The Corporation for National and Community Service is a federal agency that encourages US citizens to volunteer, particularly for federal programs like AmeriCorps. They also have an excellent data site that provides statistics on civic engagement. We used their data extraction tool to pull a few datasets, which are posted on the Library’s data repository. Here is a bar chart of the percentage of the population of large US cities which, in the previous 12 months, volunteered for a formal organization. The chart shows the averages for the years 2004 to 2011, including the standard deviation from year to year for a single city as an error bar. The numbers on the right indicate rank.

Continue Reading →

Visualize Civic Engagement

Animated map of Bikeshare station utilization. Cities thrive when citizens get directly involved in working for their city. Not only do engaged residents solve problems and guide development, but the fact they got involved makes them love their city more, and encourages the people they socialize with to also care more about their city. Because loving something and watching it grow just feels good, creating opportunities for city residents to improve their communities has benefits both for the place and for the person. Both Boston and Washing DC have popular bikeshare systems. Massachusetts’ is called Hubway, and in DC it is called Capital Bikeshare. Both are using a system operated the company Alta Bike Share, and both are very open with their data. Here is the download page for the trip data for Capital Bikeshare, where you can get detailed information about where each bicycle was rented from, and where it was returned to. Because the data is easily available many people have used the data to create their own analyses and visualizations. Some of the visualizations include an animation of riders leaving a sports stadium after a game or interactive exploration of trips between stations. Releasing the data has also resulted in useful statistics and crowdsourced suggestions for improvements. Boston embarked on a grander project, a data challenge contest that invited residents to create the best visualizations of the Bikeshare data. The Hubway Data Challenge garnered 67 entries from citizens. The contest resulted in some new insights for the people who manage the Bikeshare system, but it also gave the community a deeper understanding of how the Bikeshare system works and why it is valuable, creating a more informed electorate that will make beter future decisions. Part of the mission of the San Diego Regional Data Library is to link volunteers with city planning groups and social non profits to perform data analysis and create new visualizations, so we very interested in these sorts of events in other cities. Since the major way that nonprofits use data is to tell stories, visualization contests can generate a lot of new ways to organizations to explain what they do or help well they are doing it, both of which are critical components to getting funding and support from the community. Visualization contests are not a substitute for the deeper commitments that people make to town councils, planning groups or non profit social organizations, but they can be an important step in a pipeline that leads from people just living in a city to actively participating in its development.
Continue Reading →

That Map Does Not Mean What You Think It Means

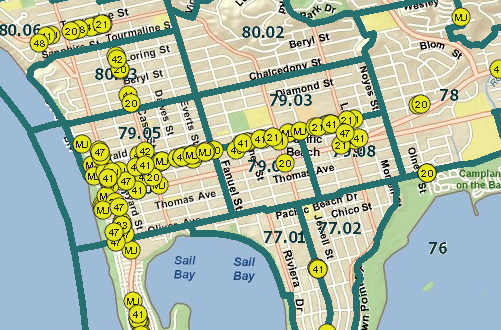
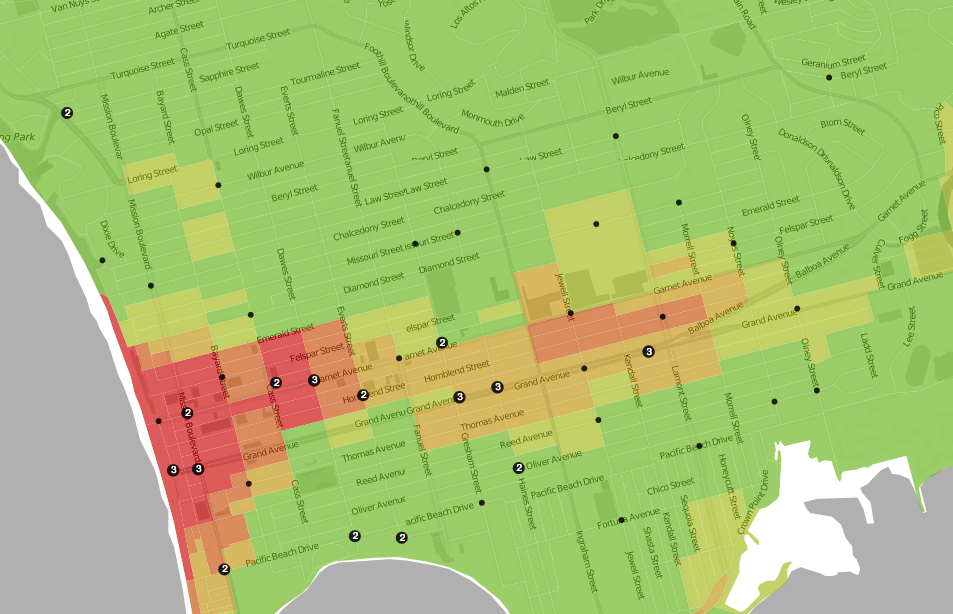
Last week I showed a wonderful heat map of crime from Trulia, that made it more clear where crimes were actually occurring. Unfortunately, the map does not really have much information; anyone who lives in the area already knows where the crime is. To illustrate, compare the crime map: Heat map of Pacific Beach, from Trulia.com Heat map of Pacific Beach, from Trulia.com To this map: Alcohol Permits in Pacific Beach Alcohol Permits in Pacific Beach

Continue Reading →

Faking a Map in Excel

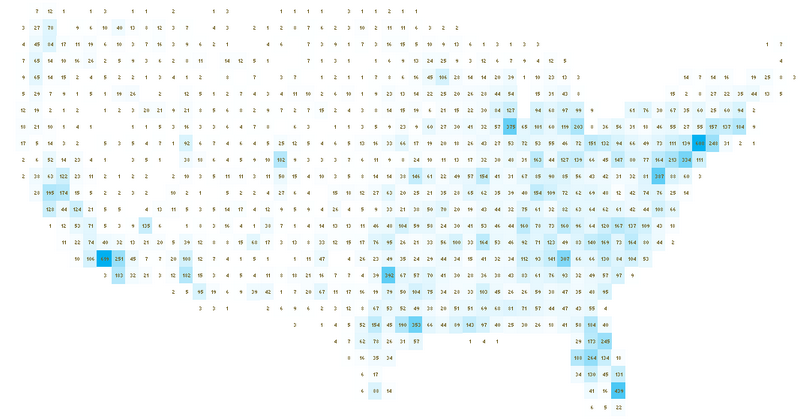
US Map Simulated in Excel. US Map Simulated in Excel. UXBlog has a wonderful guide to making fake maps in Excel. The technique involves putting values from a dataset into bins by rounding latitude and longitude, so that each cell in the spreadsheet represents one degree of lat/lon. If the color of the cell is computed from the number of datapoints that fall into each cell, the data will naturally represent a map.

Continue Reading →

Austin's Commitment to Civic Innovation

Chief Innovation Officer Job DescriptionAs part of working with the City of San Diego to develop an Open Data Policy, I and others have proposed that the city create a position for a Chief Innovation Officer, a person dedicated to identifying and developing new ways for the City to accomplish it’s job. To get a better idea of what a Chief Innovation Officer would do, see the job description for the position from the city of Austin. It’s by far the most polished job description I’ve ever seen, and demonstrates how significant the role will be to Austin’s future. It is important to note that this is not a technical position; the most specific skill requirement is ‘people skills.’ Innovation involves technical problem solving, but the most important skill is linking people who have problems with the people who can solve them, and ensuring the two are speaking the same language. If you are interested in the position, you’re too late. Austin hired Kerry O’Connor, previously a program director for the State Department.

Continue Reading →