
Data for Social Good Workshop: Homelessness and Urban Planning

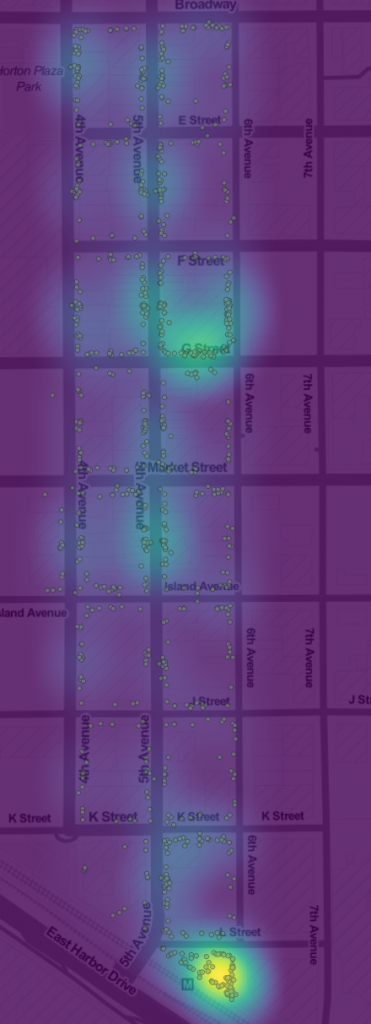
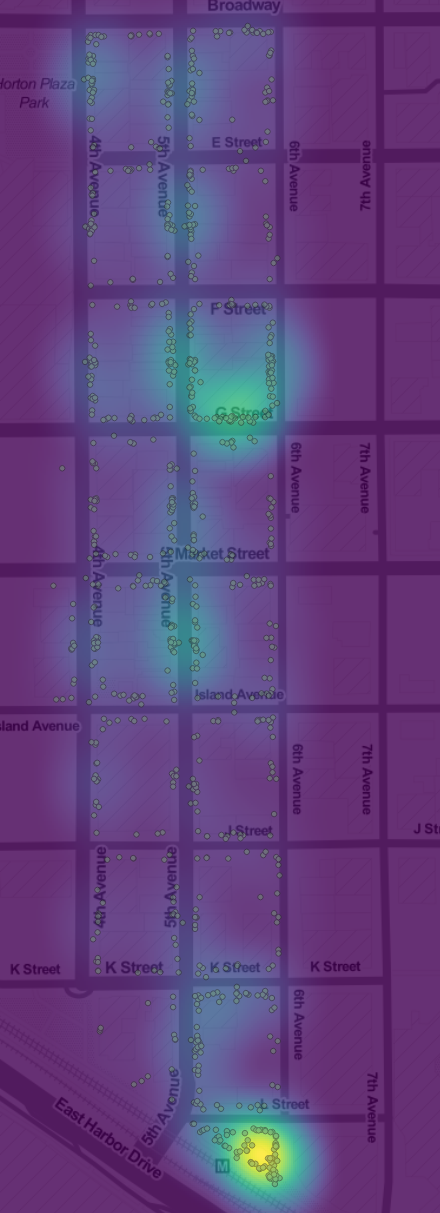
Heatmap of Homeless Count Positions, Gaslamp District, Downtown San Diego.

This is the first in a series of meetings to explore data related to homelessness and urban planning. We will present a broad range of datasets and work together to learn new techniques for data analysis. The data sets we will be using include two collections on the Library data repository:

Once we get familiar with the datasets, we’ll be soliciting data questions from non-profits, journalists and governments, to be added to our Insights Question and Answer service. Then we can use the datasets to answer important regional social questions.
Continue Reading →

Homeless in the Gaslamp District

Homeless person count locations and heat map in the Gaslamp district One of the most powerful uses of data is to give people deeper, more specific knowledge about important social issues. Many social problems can be abstract to people who don’t experience them, so making specific links to more common experiences can make the problems more concrete. Grounding the problem of homelessness is why I was so excited to discover that the Downtown San Diego Partnership had more than 5 years of monthly homeless person counts for Downtown San Diego on paper maps. We just needed to digitize the maps to make them useful. With several hundred maps in PDFs, this was going to be a big task. Fortunately, Corri-Anne Burgess, who teaches AP computer science and runs the School of Science, Connections & Technology at Kearney Senior High, was very enthusiastic about involving her students in the project. So, for the last two weeks of the year, her students digitized all of the maps for the Gaslamp district, and then did data analysis projects and presentations. This image is the points and heat map of counts for the data the students digitized. It shows two major clusters of homeless persons in the area. The cluster at C street between 5th and 6th is the south side of the Gaslamp 15 theater, which was closed in February 2016. The Theater is boarded up and has an awning, so it serves as much welcome shelter from the elements. The much more active cluster at 6th and K is a 24 hour public bathroom, one of the few in the Downtown area. Over the Summer, I’ll be working with another student team to build a web application for digitizing the rest of the maps, so hopefully, we’ll have the full dataset in about 6 months. If you’d like to explore this subset, you can download the dataset from the Library’s data repository. 

Continue Reading →

Where San Diego Parties

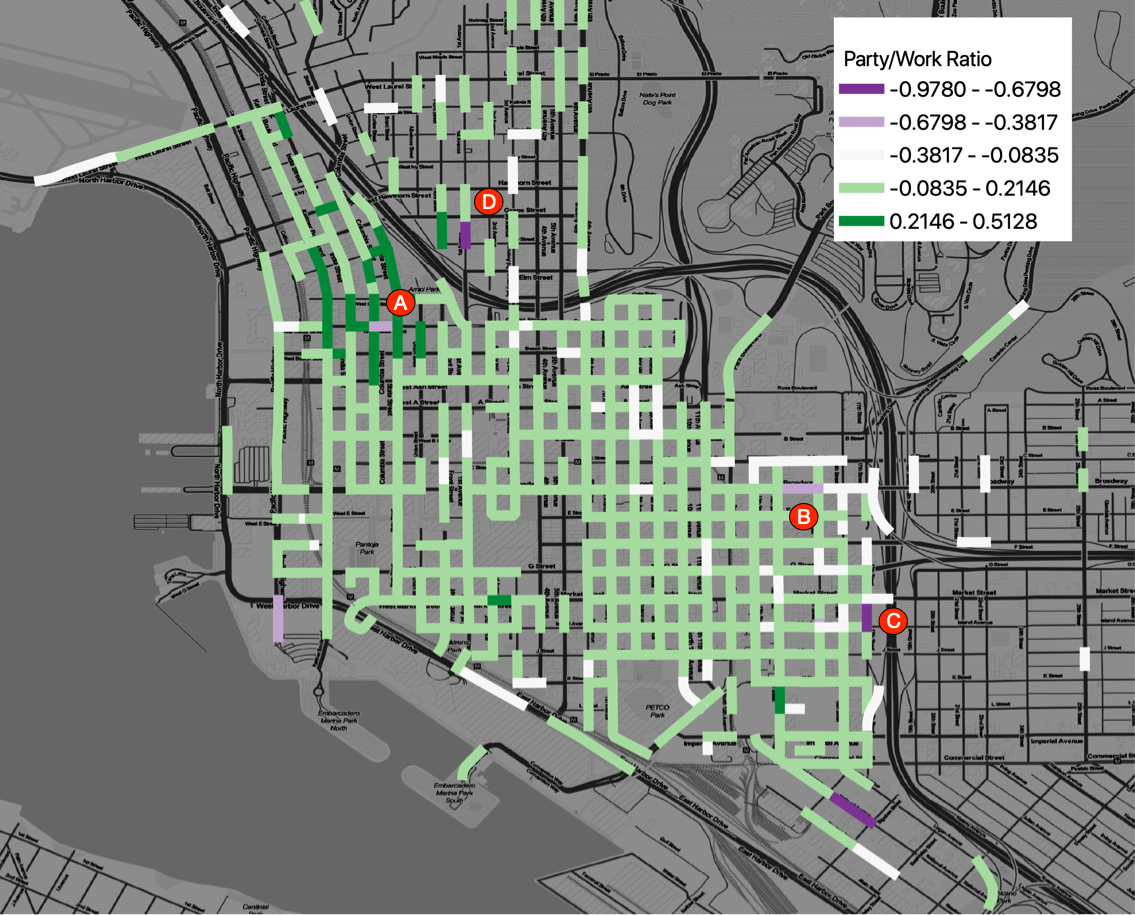
San Diego’s CityIQ system – the 4,400 smart street lamps installed across the city – yields detailed data about pedestrian movements. We’ve condensed a few hundred gigabytes of observations of pedestrians from August 2018 to June 2019 into a dataset of about 31M records, with the counts of the number of people walking in 2,600 walkways. I’d analyzed an earlier dataset to expose daily patterns of pedestrian traffic, and now, with a more complete dataset, I’m exploring other topics. The latest is a look at the streets where San Diego parties and works downtown. In this map, each street is colored according to the difference between the hourly rates of pedestrian traffic for work times ( weekdays, 6am to 5pm) and party times ( Friday and Saturday, 5PM to Midnight. ) Purple marks streets where there is much more work time pedestrian traffic, and green marks higher traffic areas for party time. Despite all of the businesses Downtown, most of the areas get more party traffic, with a few notable exceptions. In the area marked “A”, the one work street is the site of a weekday Farmer’s market; the surrounding party area is the entertainment core of Little Italy. The Area marked “B” is the downtown Police headquarters. The areas “C” and “D” are residential areas; it isn’t clear why they are work hour hot spots. For the very curious, the metric here is computed by taking the maximum count of pedestrians on any walkway per street segment per 15 minute interval, then grouping the observations into party times of the week vs work times of the week and dividing by the number of hours in the party or work periods. This gives the max hourly rate of pedestrian traffic for Work times (W) and Party times (P). Then the metric is computed as (W-P) / ( W+P).

Continue Reading →

Sharing Jupyter Notebooks with Google Colab

Google Colab offers hosted Jupyter notebooks that are integrated with Google Drive and Github. The customized Jupyter Notebook application has some nice features, and a few quirks, but has one feature that I’ve wanted for years: comments. This version of Jupyter Notebook seems perfect for collaborating on notebooks, which is otherwise very difficult. Here is a notebook that demonstrates using the Data Library’s Planning Database. You can also link directly to cells. This version of Jupyter Notebook is different enough that it takes getting used to; the keystrokes are a bit different, and the lifecycle of the kernel is a bit surprising, because you can both restart the backend IPython kernel and the container the kernel runs on. So, if you install Python modules or Debian packages, those installations will persist when you restart the kernel, but not if you restart the container. But, despite the differences, the commenting and collaboration features make any additional learning worth the effort.

Continue Reading →

New and Current Projects

Here is an overview of our current projects. If you’d like to join a project, contact Eric Busboom, eric@sandiegodata.org. Homelessness Counts. Digitize and analyze 5 years of monthly counts of the homeless in Downtown San Diego. The San Diego Downtown Partnership counts the homeless downtown every month, and now has about 5 years of paper maps recording the positions of where homeless individuals were sleeping. This project will digitize these maps, extracting the position information, to create a detailed dataset. Then we will analyze the data, by linking homelessness to land use, business location and traffic patterns. The project can be done with manual GIS work, but would be best done with image recognition to geo-reference the maps and extract handwritten marks. Needs:

Continue Reading →

New Data Projects: College, Hunger and Homelessness

We will soon be getting started with three new data projects:

For the San Diego Hunger Coalition, we will be collecting a lot of datasets, combining them into a package, and supporting the SDHC staff in data analysis. The project will involve a lot of data sleuthing and wranging. For Reality Changers, we will be building an analysis data package form a collection of Google spreadsheets, then analysing student performance. For San Diego Downtown Partnership we will be digitizing 5 years of monthly homelessness count maps, then analyzing the changes in downtown homelessness and the relationship between homelessness presence and land use. If you’d like to join one of these projects, be sure to join one of our announcement channels: our Meetup group, the mailing list, Facebook, or Twitter, all linked from our Contact page. I’ve got a bit more project initiation tasks, then we will send out complete announcements for each project, later this week.

Continue Reading →

Big Data Hackathon Workshop

For this workshop, you will need to install:

Review of Data Sources

Major Concepts

  • Census, Tracts and Zip Codes
  • Joins: Attribute and Spatial

Datasets to load

Agenda

Continue Reading →

30 Million San Diego Parking Records

San Diego has the world’s largest municipal Internet-of-things deployment, which I got access to recently and have been pulling data from. I’ve now got about 30 million parking records – events when a car enters or leaves a parking zone – and have been processing and analyzing the data for the last few weeks. The raw data is a bit difficult to use, because there are a lot of spurious events, but it isn’t hard to clean them out. The result is records, at 15 minute intervals, of the number of cars parked in each of the 6,600 parking zones across the city. Here are the two processed datasets.

Continue Reading →