
Probably the most common statistic that people deal with is the average, which can often be a good approximation of the typical or general case. However, there are many cases where the average fails, and the most extreme example I’ve seen in recent data is lawyers’ salary distributions. The NALP has been publishing salary distributions for a few years, and the blog Social Evolution Forum provides a good overview of the distribution. Since 2000 or so, the distribution is extraordinarily bi-modal, making the average, as well as the median, a poor statistic to represent the typical case.  In these situations, the average is meaningless, and it is better to report the two ( or three ) modes. The Blog Empirical Legal Studies has more of the charts and a discussion about the system that created them.
Student Data Analysis Contest
Along with SDSU and Teradata, the San Diego Regional Data Library is running a data analysis contest for San Diego area High School and College students. The contest starts February 28. Top prize is $1200. For complete details and to register, see the contest announcement page.
SDSU Datathon
Solve Social Problems for $2,700 in Prizes
The San Diego Regional Data Library, the SDSU Society for Statisticians and Actuaries and Teradata are organizing a data analysis contest to aid nonprofits, journalists and government agencies in making better use of data, develop a broader regional capacity for data analysis, and introduce students interested in data analysis to future employers. In this contest, student teams will work on one of three projects, addressing education, food insecurity or community development. After the February 28th kick off, teams will have one week to analyze the data and visualize the analysis, before presenting the results to the public at the March 10 awards ceremony. Data Science FunConference. The Data Contest is running together with a Data Science Conference run by the Python Meetup group, 5 other meetup groups, companies and universities. The conference will feature training sessions, data science training, and software demos. Visit the conference registration page for a full schedule. No Experience Necessary. This event will be held in conjunction with the San Diego Python User Group and San Diego Data Science, who will be offering a data science training class the morning before the contest kickoff. Come early to learn data analysis techniques in your favorite language, then apply them in the contest later in the afternoon. Additionally, Teradata employees will serve as mentors to teams, to offer guidance or help if you get stuck. No Team Required. Singleton analysts are welcome! You can come early for the training session to meet other single analysts, or join a team at the event. College, High-school or Pro. The contest is open to high-school students and college students. Professionals and post-students are welcome to participate too, but only students are eligible for prizes.
Viz Crime with Python and Javascript, Go To Cool Parties With Free Food
We’re looking for some programers to visualize crime data and present it at our booth at the San Diego Magazine Big Ideas Party on Jan 21. The Data Library was one of the 25 Big Ideas covered in their January issue, so they’d like us to have a presentation at the party. I’d like to have an interactive display, probably using D3, that shows a crime hot spot map for the region, as well as a collection of time-based Rhythm maps for selected areas. A visitor to the booth could select a neighborhood or city, see the hot spots in that area, and see how the crime incidents change in that area over time. So, we’ll need a Python programmer for the server side ( Pandas for analysis, Flask or similar for the server ) and Javascript person for the front end. Someone with solid visual design skills would be a plus. You’ll get a ticket to the party on the 21st, to share in the glory, get free food, and do some high-quality hobnobbing. If you are interested, send me an email, with a link to your Github/Bitbucket/etc account or portfolio, to eric@sandiegodata.org. We can use any number of volunteers, but I only have three free tickets.
Little Data is a Big Idea
Even little data, such as a list of crime incidents, locations of bus stops, or population growth estimates, is a big idea, at least according to San Diego magazine’s 25 BIG Ideas.
Data Analysis For Your Mission
Sponsor a Project in Our Student Data Analysis Contest
Give your nonprofit, agency or news organization valuable data-driven insights by sponsoring a project at our student data analysis contest. The San Diego Regional Data Library, the SDSU Society for Statisticians and Actuaries and Teradata are organizing a data analysis contest to aid nonprofits, journalists and government agencies in making better use of data, develop a broader regional capacity for data analysis, and introduce students interested in data analysis to future employers. Contestant teams will have one week in early March 2015 to answer a set of data-driven questions and visualize the results for one of four projects. Each project will be provided by a nonprofit, government agency or news organization. The contest will be announced in early January, primarily to college students. For a month before the contest begins, the San Diego Regional Data Library will run a special session of its Practical Data Program to train contestants on using data, Python, R, and IPython to analyze data. If you are interested in being involved in the contest, as a project sponsor, mentor or contestant, visit the overview page or contact Eric Busboom at eric@sandiegodata.org, or (619) 363-2607.
When Will Data.gov be Useful?
Data.gov is the top level data search system for the US, with references to over 130,000 datasets from federal and state agencies. And yet, I’ve never successfully used it for finding data. Here is an example search for “Diabetes Rates”: 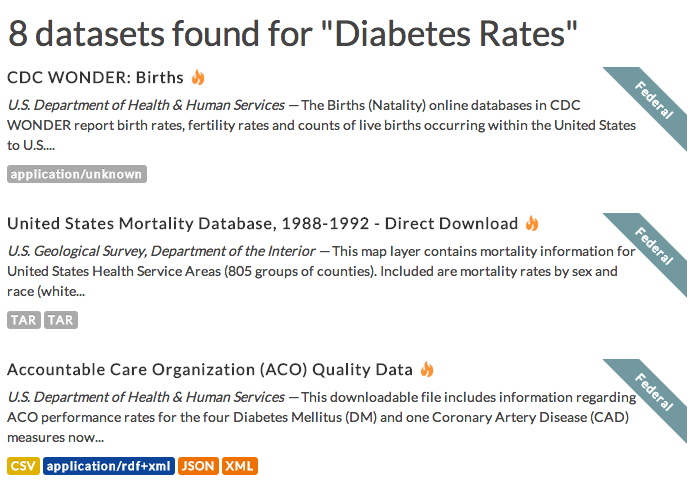 Search for “Diabetes Rates” on Data.gov So, we look for diabetes, and get births, 22 year old mortality data from the US Geological Survey, and quality of service data as the first three hits. The first link at least points to the right agency, but you still have to click three times to get there. Here is the same search on Google:
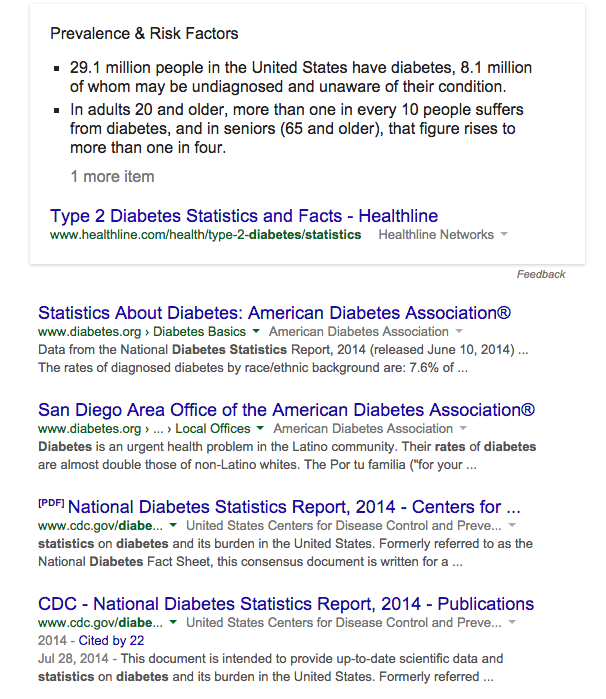 Search for Diabetes Rates on Google. Not only do I get links to real primary organizations, the fourth hit is the original source of the data, and Google helpfully gives us quick stats before the hits. Even better, if you search for “diabetes rates data” you are one click away from the primary data source for US diabetes rates. The really poor quality of search results on Data.gov has been a problem for its entire existence; I’ve never done a data search on Data.gov that returned what I wanted. I’ve always had better results with Google or browsing the website of the agency that produces the data. Data.gov has been around for about 5 years, and despite human curation is still isn’t as useful as Google’s automatic index. At some point, I’d like to stop being excited by its possibilities, and start being excited by it utility.
Tableau Workbook for SWITRS
Here is the Tableau workbook that we’ll be using for the SPJ Hacks/Hackers Data Show event tonight. You can also get links to all of the documentation from our data warehouse.
Student Data Analysis Contest
Give your nonprofit, agency or news organization valuable data-driven insights by sponsoring a project at our student data analysis contest. The San Diego Regional Data Library, the SDSU Society for Statisticians and Actuaries and Teradata are organizing a data analysis contest to aid nonprofits, journalists and government agencies in making better use of data, develop a broader regional capacity for data analysis, and introduce students interested in data analysis to future employers. Contestant teams will have one week in early March 2015 to answer a set of data-driven questions and visualize the results for one of four projects. Each project will be provided by a nonprofit, government agency or news organization. The contest will be announced in early January, primarily to college students. For a month before the contest begins, the San Diego Regional Data Library will run a special session of its Practical Data Program to train contestants on using data, Python, R, and IPython to analyze data. The contest will be judged based on both the work submitted by the teams after the end of the week and the teams’ presentations’ at an evening event the following week. We are recruiting sponsoring organizations to participate in the contest as:
Veterans Density by County
Voice of San Diego has published a story we supported, a fact-check about the density of veterans in San Diego County. You can get all of the data behind the story – including schemas and SQL queries ! – in our data warehouse.