
San Diego’s CityIQ system – the 4,400 smart street lamps installed across the city – yields detailed data about pedestrian movements. We’ve condensed a few hundred gigabytes of observations of pedestrians from August 2018 to June 2019 into a dataset of about 31M records, with the counts of the number of people walking in 2,600 walkways. I’d analyzed an earlier dataset to expose daily patterns of pedestrian traffic, and now, with a more complete dataset, I’m exploring other topics. The latest is a look at the streets where San Diego parties and works downtown. In this map, each street is colored according to the difference between the hourly rates of pedestrian traffic for work times ( weekdays, 6am to 5pm) and party times ( Friday and Saturday, 5PM to Midnight. ) Purple marks streets where there is much more work time pedestrian traffic, and green marks higher traffic areas for party time. 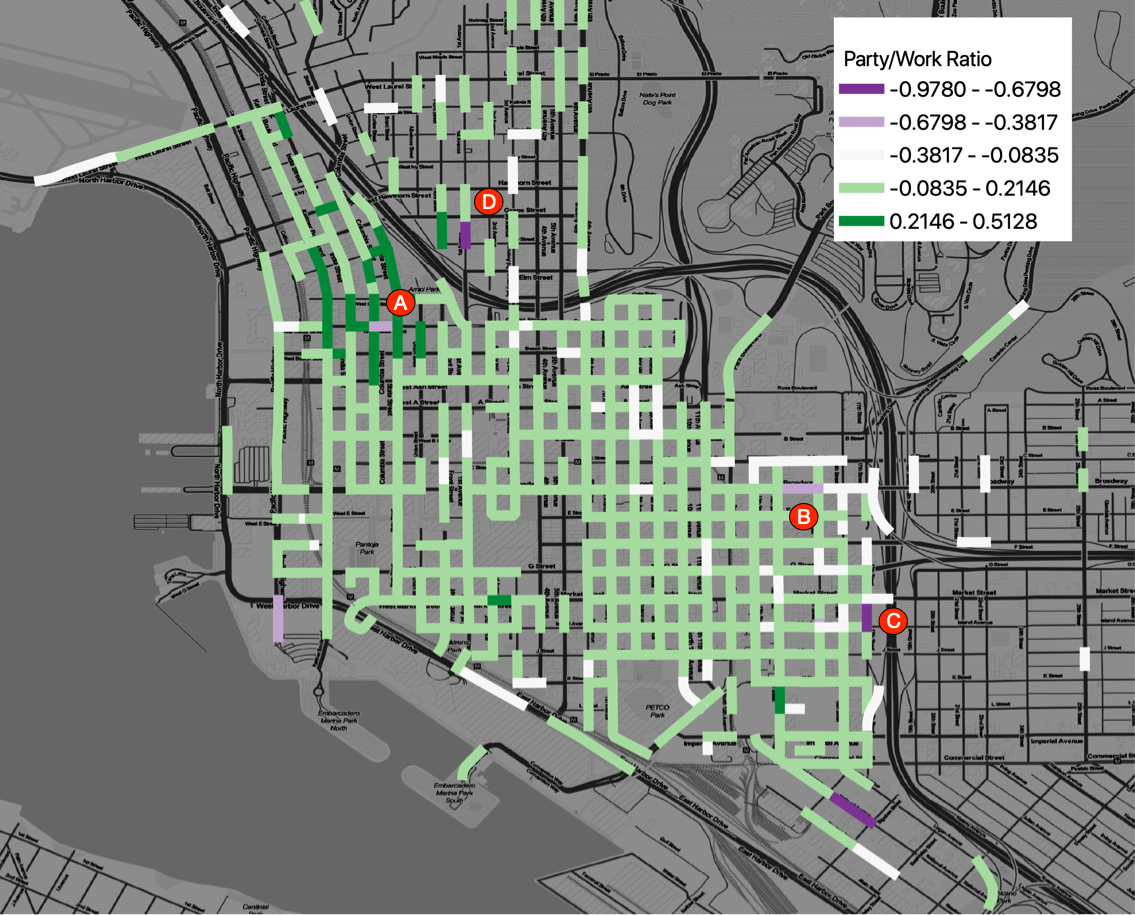 Despite all of the businesses Downtown, most of the areas get more party traffic, with a few notable exceptions. In the area marked “A”, the one work street is the site of a weekday Farmer’s market; the surrounding party area is the entertainment core of Little Italy. The Area marked “B” is the downtown Police headquarters. The areas “C” and “D” are residential areas; it isn’t clear why they are work hour hot spots. For the very curious, the metric here is computed by taking the maximum count of pedestrians on any walkway per street segment per 15 minute interval, then grouping the observations into party times of the week vs work times of the week and dividing by the number of hours in the party or work periods. This gives the max hourly rate of pedestrian traffic for Work times (W) and Party times (P). Then the metric is computed as (W-P) / ( W+P).
Sharing Jupyter Notebooks with Google Colab
Google Colab offers hosted Jupyter notebooks that are integrated with Google Drive and Github. The customized Jupyter Notebook application has some nice features, and a few quirks, but has one feature that I’ve wanted for years: comments. This version of Jupyter Notebook seems perfect for collaborating on notebooks, which is otherwise very difficult. Here is a notebook that demonstrates using the Data Library’s Planning Database. You can also link directly to cells. This version of Jupyter Notebook is different enough that it takes getting used to; the keystrokes are a bit different, and the lifecycle of the kernel is a bit surprising, because you can both restart the backend IPython kernel and the container the kernel runs on. So, if you install Python modules or Debian packages, those installations will persist when you restart the kernel, but not if you restart the container. But, despite the differences, the commenting and collaboration features make any additional learning worth the effort.
GIS For Journalists: map making and geographic analysis.
We’re planning a workshop to train Journalists in GIS and Map making techniques. Please fill out this form to help us schedule a workshop that you can attend and will benefit from. Loading…
Big Data Hackathon Workshop
For this workshop, you will need to install:
Review of Data Sources
- Data Lists for the Hackathon
- Census Reporter
- Healthy Places Index
- Sangis
- Planning Database
Major Concepts
- Census, Tracts and Zip Codes
- Joins: Attribute and Spatial
Datasets to load
- Census Reporter. Median Household Income in the Past 12 Months
- San Diego Tracts and Communities
- Healthy Places Index
- County Planning Database
- San Diego Crime Incidents
- Alcohol Permits
- SANGIS Business Sites
Agenda
30 Million San Diego Parking Records
San Diego has the world’s largest municipal Internet-of-things deployment, which I got access to recently and have been pulling data from. I’ve now got about 30 million parking records – events when a car enters or leaves a parking zone – and have been processing and analyzing the data for the last few weeks. The raw data is a bit difficult to use, because there are a lot of spurious events, but it isn’t hard to clean them out. The result is records, at 15 minute intervals, of the number of cars parked in each of the 6,600 parking zones across the city. Here are the two processed datasets.
2019 SDSU Big Data Hackathon
SDSU’s Annual Big Data Hackathon is scheduled for March 9 and 16. This year’s prize pool is $3550, in multiple categories, for innovative ideas and implementations around the theme of “Smart Living”. Visit the hackathon web site and register before the Feb 22 deadline.
$6k Data Grant for Nonprofits
The Data Library is offering a grant for $6,000 of data services, which nonprofits might use site planning, donor segmentation, analyzing client retention, data storytelling and other operational improvements. If you are looking for data help for your organization, visit the Data Grant web page for application guidelines and deadlines.
Hacks and Hackers: Support data journalism with data analysis
Test your skills and help SDSU journalism students with a class project. The Data Library will be helping SDSU Digital Journalism students with an interesting joint project: students ask data questions, we give data answers, and they write articles. You can test your data skills, and maybe learn a few new skills, by helping to answer some of the questions. Over the next week, the students will be formulating interesting questions about San Diego business, demographics, environment, traffic and other issues. They’ll submit the questions to our Data Insights Question and Answer service, where we will answer the data questions. Then, the students will write news articles about the insights. If you’d like to work on data questions, we’ll be meeting regularly:
How to Write a Good Data Question
Our Insights Service is a Question and Answer site for data questions, to make it easier for civic-minded San Diegans to better understand our local issues. However, it can be difficult to ask a good question that our analysts can answer. Here are some tips for writing a good data question. A good data question is specific and asks “when”, “how much,” “how many,” or “what is most”. It should have an answer that is something that is countable, usually a number of people, a number of dollars or the number of times something happened. The easiest questions to answer are formulated with a dataset in mind, or a hunch about what data you might find. Some places to find datasets that can help you understand what you can ask and get good answers for are:
Answer Data Questions On Saturday
This Saturday we will be meeting, at the regular Python Saturday Meetup session, to work on some of the data questions in our Insights Q&A service. To attend, please RSVP at both:
Hope to see you there!