
New Data Projects: College, Hunger and Homelessness

We will soon be getting started with three new data projects:

For the San Diego Hunger Coalition, we will be collecting a lot of datasets, combining them into a package, and supporting the SDHC staff in data analysis. The project will involve a lot of data sleuthing and wranging. For Reality Changers, we will be building an analysis data package form a collection of Google spreadsheets, then analysing student performance. For San Diego Downtown Partnership we will be digitizing 5 years of monthly homelessness count maps, then analyzing the changes in downtown homelessness and the relationship between homelessness presence and land use. If you’d like to join one of these projects, be sure to join one of our announcement channels: our Meetup group, the mailing list, Facebook, or Twitter, all linked from our Contact page. I’ve got a bit more project initiation tasks, then we will send out complete announcements for each project, later this week.
Continue Reading →

Pro Bono Data Analysis This Summer

link Disadvantaged Student Performance For Summer of 2017, The San Diego Regional Data Library will be running a data internship program, working on pro-bono data analysis projects for nonprofits, governments and journalists in San Diego County. If your organization has questions that can be answered with data, you can have an undergraduate data analyst work on your project, with professional guidance, for up to 12 weeks. Project sponsors must be able to describe their needs as a set of questions that can be answered with available data, and must be able to meet with the interns at their site for 1 hour per week. Projects must have a social goal or benefit. We’re currently running two projects, and expect to be running three or four more this summer. If your organization needs data analysis this summer, please contact the Data Library Director, Eric Busboom at (619) 363-2607 or eric@sandiegodata.org.

Continue Reading →

Age Friendly Communities Project

At tomorrow night’s meeting, we’ll be kicking off two new data projects. The first is the Health Food Access project, previously announced, and the second is the Age Friendly Communities project, for which we’ve just posted the project page. In this project we will be collecting data to analyze the capacity and affordability of San Diego’s assisted living industry, considering the anticipated need for these services over the next 30 years. Hope you can join us.

Continue Reading →

Wrangling Data For Social Projects

Next week we’ll be kicking off two new data projects, and a big part of these projects will be finding data, documenting it, and preparing it in a consistent way for analysis, a process known as data wrangling. I’ve been developing software for wrangling social data for a few years, and have collected many of the best ideas into a new metadata system called Metatab. Metatab is a system for storing structured metadata in a CSV file, often alongside data, making it easier to create and publish metadata. In the next two data projects, we will using the Metatab Google Spreadsheet Add-On to document data we locate for the two projects. Once a metatab specification is created for a dataset, it can be uploaded to CKAN, our data repository software directly from the Google spreadsheet system. And I’m currently working on other tools for finding and manipulating data. When we are done with the main data wrangling, there will be collections of datasets in our main data repository related to food access and assisted living, and then we can start on data analysis, most likely using Pandas and Tableau, but we may also tackled using a few AWS tools like AWS Athena and AWS Quicksight. Register for the Meeting

Continue Reading →

Healthy Food Access Data Library Project

Collect and analyze data about the food system in San Diego county.

The San Diego Food System Alliance’s Healthy Food Access Working Group is developing an indicator library to analyze food access issues, and we need your help to locate datasets, wrangle them into useable shape, and create visualizations.

The work is similar to the topics of our March 2015 Data Contest, with additional work of building a reusable data library to perform additional analysis.

Continue Reading →

Viz Crime with Python and Javascript, Go To Cool Parties With Free Food

We’re looking for some programers to visualize crime data and present it at our booth at the San Diego Magazine Big Ideas Party on Jan 21. The Data Library was one of the 25 Big Ideas covered in their January issue, so they’d like us to have a presentation at the party. I’d like to have an interactive display, probably using D3, that shows a crime hot spot map for the region, as well as a collection of time-based Rhythm maps for selected areas. A visitor to the booth could select a neighborhood or city, see the hot spots in that area, and see how the crime incidents change in that area over time. So, we’ll need a Python programmer for the server side ( Pandas for analysis, Flask or similar for the server ) and Javascript person for the front end. Someone with solid visual design skills would be a plus. You’ll get a ticket to the party on the 21st, to share in the glory, get free food, and do some high-quality hobnobbing. If you are interested, send me an email, with a link to your Github/Bitbucket/etc account or portfolio, to eric@sandiegodata.org. We can use any number of volunteers, but I only have three free tickets.

Continue Reading →

Drugs and Alcohol in Downtown and East Villiage

For the last few months, a team of geography students at SDSU have been working with the crime data provided by the Library, producing analyses and visualizations of the data. Elias Issa has been looking at Drugs and Alcohol violations in Downtown San Diego and East Village. He writes:

The Hot Spot tool calculates the Gi* statistic for each feature in a dataset. The resultant z-scores and p-values tell you where features with either high or low values cluster spatially. To have a statistically significant hot spot, a feature will have a high value and be surrounded by other features with high values as well. My animated maps illustrate 2 hot spots from 2007 to 2012. the most significant hot spot is located close to St. Vincent Paul homeless shelter ( Imperial Ave) on the South Eastern part of East Village. The second hot spot is located North of Gaslamp Quarter between Broadway And Market which most of the famous and popular bars are found. In addition to those map,and based on those hot spots, I did some statistical analysis to show the average of Drugs/ Alcohol violation monthly (Above/ Below Avg) and yearly. My study reveals that there is a slight increase within 2011 and 2012 in the average of Drugs/ Alcohol violations.

Continue Reading →

Population Density Maps

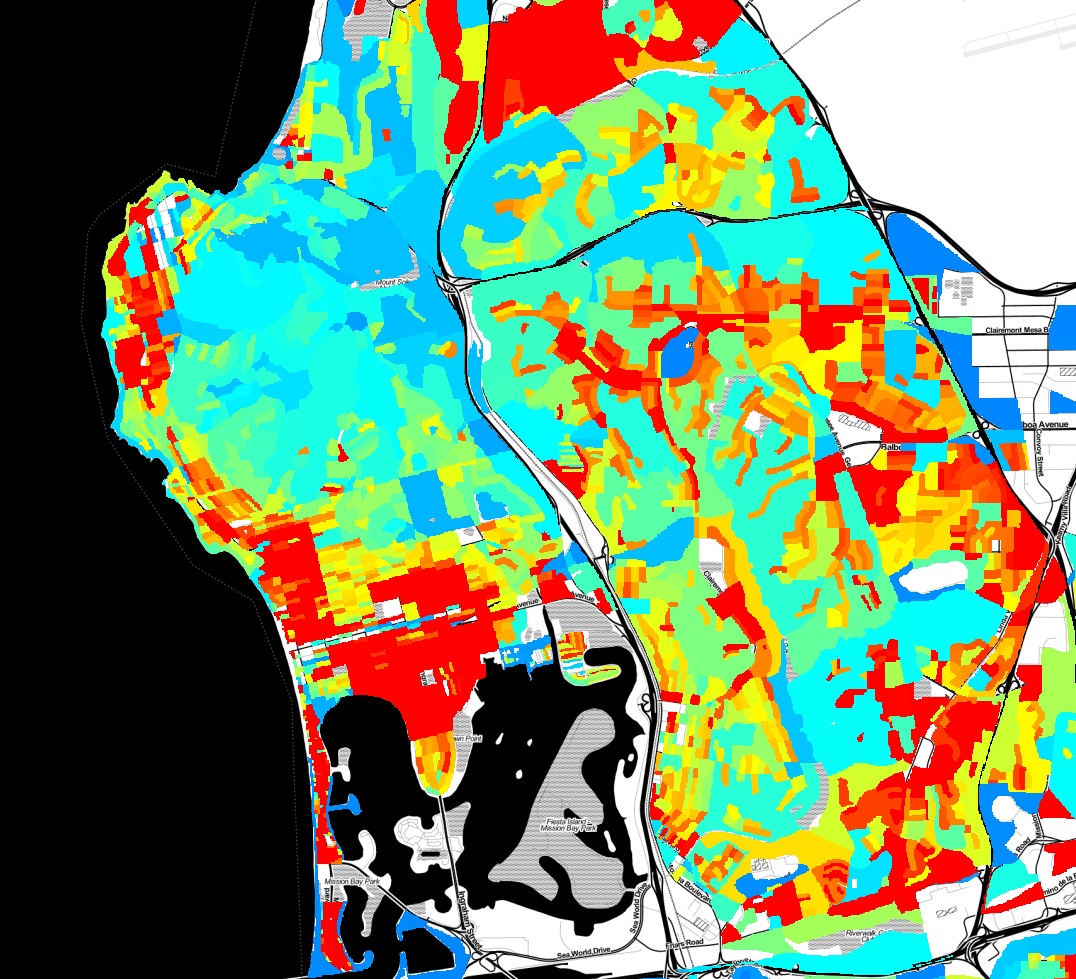
Here is some eye candy, a population density map of Pacific Beach and surrounding neighborhoods.

population-density-map

This map was created with a lot of Python code, using the 2010 census shapefiles for census blocks, setting a value for each block as the population of the block divided by the area of the block, and rasterizing all of the blocks to an image. Red indicates areas of higher population density. You can clearly pick out the areas in Pacific Beach that are zoned for apartments vs single family homes, the UTC high-rise apartment area, and many other variations in land use.

Continue Reading →

What Is Crime Analysis?

On Wednesday March 6 we’ll kick off our Crime Data Analysis project, and before then, it may be worth asking “Why are a bunch of amateurs attempting what the police should be doing? " The answer is that police departments analyze crime to catch criminals, and the Data Library analyzes crime to help residents understand their own communities. We data geeks aren’t very good at catching criminals, so we’re happy to leave that task to the pros. Our project will cover only two small aspects of the field of Crime Analysis. We’ll be doing strategic analysis, looking at long term trends, and descriptive administrative analysis, which is creating summary reports for community leaders. So, some of the activities that we’ll tackle as part of this project are:

Continue Reading →

Fight Crime with Data

Citizens of any skill level are invited to help us analyze crime in San Diego neighborhoods. Use your knowledge of the community or technical skill to create maps, discover anomalies, and better understand the causes and solutions to crime in San Diego. Come to the Kickoff meeting by signing up at Meetup.com Crime is always a top issue for any community, but San Diego residents, town councils and community planning groups seldom see neighborhood analysis of where crime occur, and less frequently get analysis of how crime relates to factors such as street lighting, traffic, housing, or alcohol. In this project we will collect data from the city, state and private organizations to create a range of maps and statistics that explain where crime is occurring and what factors are involved in increases or decreases in crime. This project needs your help,regardless of your skills or skill level. You can participate as a non technical community activist, Excel jockey, GIS expert, beginning programmer or experienced statistician. Want to know more?

Continue Reading →