
PSID Active Savings 89 and 94

Measurements of money flows into savings, housing and annuities.

isr.umich.edu-psid-89_94-actsav-1.1.1. Modified 2023-06-06T23:18:39

Resources

  • act94. Active savings, 1994
  • act89. Active savings, 1989

Documentation

Contacts

  • Wrangler

Eric Busboom, Civic Knowledge

Data Dictionary

act89 | act94

act89

Column NameData TypeDescription
act89v1numberRELEASE NUMBER
act89v2integer1989 INTERVIEW NUMBER
act89v3integerPUT INTO ANNUITY
act89v4integerCASH IN ANNUITY
act89v5integerBUY REAL ESTATE
act89v6integerSELL REAL ESTATE
act89v7integerHOME IMPROVEMENT
act89v8integerBUY BUSINESS
act89v9integerSELL BUSINESS
act89v10integerASSETS MOVE OUT
act89v11integerDEBTS MOVE OUT
act89v12integerASSETS BROUGHT IN
act89v13integerDEBTS BROUGHT IN
act89v14integerFIRST GIFT/INHERITANCE
act89v15integerSECOND GIFT/INHERITANCE
act89v16integerNET INTO STOCK

act94

Column NameData TypeDescription
act94v1numberRELEASE NUMBER
act94v2integer1994 INTERVIEW NUMBER
act94v3integerPUT INTO ANNUITY
act94v4integerCASH IN ANNUITY
act94v5integerBUY REAL ESTATE
act94v6integerSELL REAL ESTATE
act94v7integerHOME IMPROVEMENT
act94v8integerBUY BUSINESS
act94v9integerSELL BUSINESS
act94v10integerASSETS MOVE OUT
act94v11integerDEBTS MOVE OUT
act94v12integerASSETS BROUGHT IN
act94v13integerDEBTS BROUGHT IN
act94v14integerFIRST GIFT/INHERITANCE
act94v15integerSECOND GIFT/INHERITANCE
act94v16integerTHIRD GIFT/INHERITANCE
act94v17integerNET INTO STOCK
act94v18integerSELL MAIN HOME

References

Urls used in the creation of this data package.
Continue Reading →

General Social Survey

General Social Survey collects information and keeps a historical record of the concerns, experiences, attitudes, and practices of residents of the United States.

norc.org-gss-2021-1.1.1. Modified 2023-03-04T17:10:58

Resources

Documentation

Caveats

This package is an extract meant for a specific workflow. For general analysis, you should almost certainly use an extract generated from the GSS website.

Using the Data Files

The variables in this package are almost entirely categorical, but the data is stored with codes, with the categorical labels stored seperately in the _labels reference. When opening the file with Metapack, the convert_categorical argument ( which defaults to True ) controls converting the codes to labels.

Continue Reading →

Current Population Survey, 2023

The Current Population Survey (CPS) is the primary source of labor force statistics for the population of the United States.

census.gov-cps-2023-basic_monthly-1.1.2. Modified 2023-03-02T18:24:15

Resources

Documentation

Contacts

  • Wrangler

Eric Busboom, Civic Knowledge

Data Dictionary

cps202301 | variable_descriptions | variable_values

Continue Reading →

Geographical Region Names

Country names, and names for US countries, metros, cities and states.

civicknowledge.com-geonames-2022-1.2.43. Modified 2023-02-23T18:37:42

Resources

Documentation

Contacts

  • Wrangler

Eric Busboom, Civic Knowledge

Data Dictionary

names

names

Column NameData TypeDescription
refstring
geoidstring
categorystring
weightinteger
nametext

References

Urls used in the creation of this data package.
Packages

Accessing Data in Vanilla Pandas

import pandas as pd


names_df =  pd.read_csv('https://library-metatab-org.s3.amazonaws.com/civicknowledge.com-geonames-2022-1.2.43/data/names.csv')

Accessing Package in Metapack

import metapack as mp
pkg = mp.open_package('https://library-metatab-org.s3.amazonaws.com/civicknowledge.com-geonames-2022-1.2.43.csv')

# Create Dataframes
names_df = pkg.resource('names').dataframe()
Continue Reading →

Crime Data Heatmaps

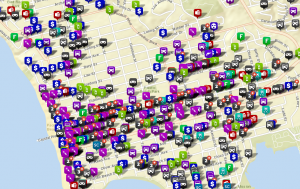
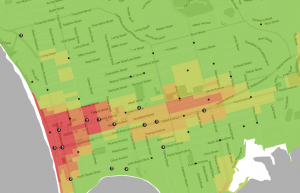
A heat map is a way of presenting data that makes it much easier to understand the density of a variable. Rather than just plotting each pont on a map, a point on a heatmap adds a bit of ’temperature’ to a location, so a lot of points close together make an area “hotter”. There are several ways of constructing heatmaps, but they all generally represent the areal density of a variable, and when the viewer is most concerned with density, they are the best representation. For instance, here is a typical crime map, showing an icon for each crime incident: Crime map from Crimedata.com Crime map from Crimedata.com While this map is useful for determining what crime incidents may have been recorded near a particular address, the size of the icons obscures the variation in incident density. Here is a map of the same area, from the Trulia Crime Maps website, presented as a heat map: Heat map of Pacific Beach, from Trulia.com Heat map of Pacific Beach, from Trulia.com The heat map isn’t useful for getting information about a particular incident, but it is a much better representation of where crime is happening, in this case, clustered around bars and the beach, while few incident are occurring in the residential areas. This crime heat map of London allows you to adjust the radius that each crime incident contributed to the map, as well of intensity of the event, so you can get a sense for how those parameters work. If you’d like to generate your own heat maps, many GIS programs can create them, and heat maps are increasingly common in web-based mapping services. Here are a few online services you might try:

Continue Reading →